Some feedback from our public consultation activity is that there is a disconnect in understanding between resource / waste management and its impact on climate change. This is not surprising because the interactions are complex. Even climate change specialists can pay scant attention to waste, and this has been evident by the lack of ‘air time’ at the COP meetings. However good use of resources and more importantly consideration of our consumption of products and goods, can yield substantial carbon benefits and we will not reach our net zero ambitions without it.
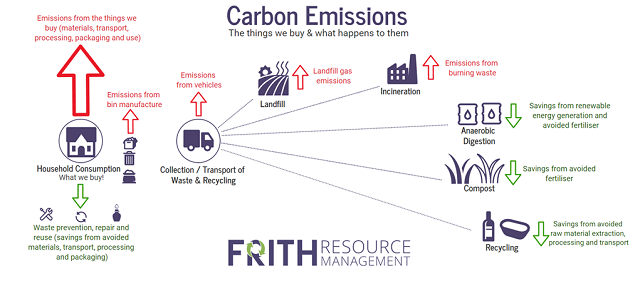
When we focus on the carbon impact of resources and waste, it becomes a story to convey, rather than a straight factor. We have simplified this into the following infographic that supports our discussions with members and officers of Councils when engaging on this topic.


It is easy for consultants to take complex subjects and convey them in a complex manner. We always try and make complex subjects relatable. We do this either by developing carbon calculators that generate outputs to suit Councils reporting, or using existing proprietary models to calculate impacts. Our messages are backed up by data and modelling, but summarised in an accessible way so decisions can be appropriately informed and understood.
An example of this is something that will affect lots of Councils in the next few years – inclusion of plastic film within separate collections. This has a minor carbon benefit in terms of the recycling of that material (depending on whether this is chemical recycling or reprocessing), it is likely to have a very minor detrimental impact on the collection (vehicle) carbon impacts. It will however have a significant benefit in reducing carbon emissions from the residual waste, if processed via an Energy from Waste plant, as burning plastics is like burning oil in the facility - it generates a lot of energy but this effectively all comes from a fossil fuel.
The ‘plastic film’ example above illustrates that it is necessary to look across the life cycle of the waste (as shown in the infographic) in order to understand the carbon impact. Whilst this becomes a multi-stage calculation (looking at the waste composition, collection, transport, recycling and treatment operations), the consequences can be summarised in the above two italicised sentences, with the addition of the relevant numbers.
Frith Resource Management undertake carbon modelling ranging from products through to whole waste management systems. We also consult and engage with the public on Net Zero and Resource Management Strategies. For details see www.frithrm.com call 01746 552423 or email paul@frithrm.com


